 Facebook
 X
X
 Pinterest
 Copy Link
For Sale, Brier, WA Rambler, 4 Bedroom Presented by John Fiala Windermere

MLS# 933289
Updated Brier Rambler. This move-in-ready home tucked off the street features 4 bedrooms, 1.75 baths and is 1692 sqft. Updates include double pane windows, roof & siding. You will enjoy the large master bedroom with walk in closet, wood burning fireplace, and ¾ attached bathroom. Spread out in the large living room with second wood burning fireplace. Kitchen features stainless steel appliances and eating area. Other features include a large yard, huge deck wired for hot tub, and storage a shed.

Mercer Island WA View Home for Sale, First Hill, 4 Bedrooms, Presented By John Fiala Windermere
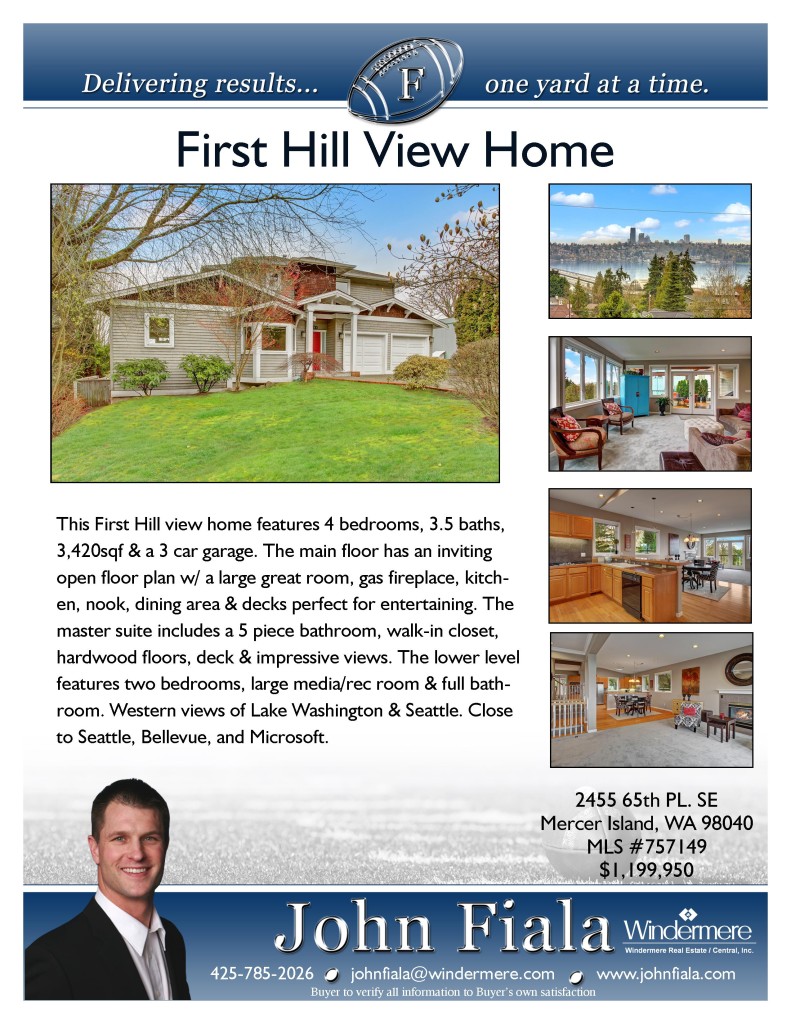
MLS #757149
This First Hill view home features 4 bedrooms, 3.5 baths, 3,420sqf & a 3 car garage. The main floor has an inviting open floor plan w/ a large great room, gas fireplace, kitchen, nook, dining area & decks perfect for entertaining. The master suite includes a 5 piece bathroom, walk-in closet, hardwood floors, deck & impressive views. The lower level features two bedrooms, large media/rec room & full bathroom. Western views of Lake Washington & Seattle. Close to Seattle, Bellevue, and Microsoft.

King County Home Trends. Active vs Pending, presented by John Fiala
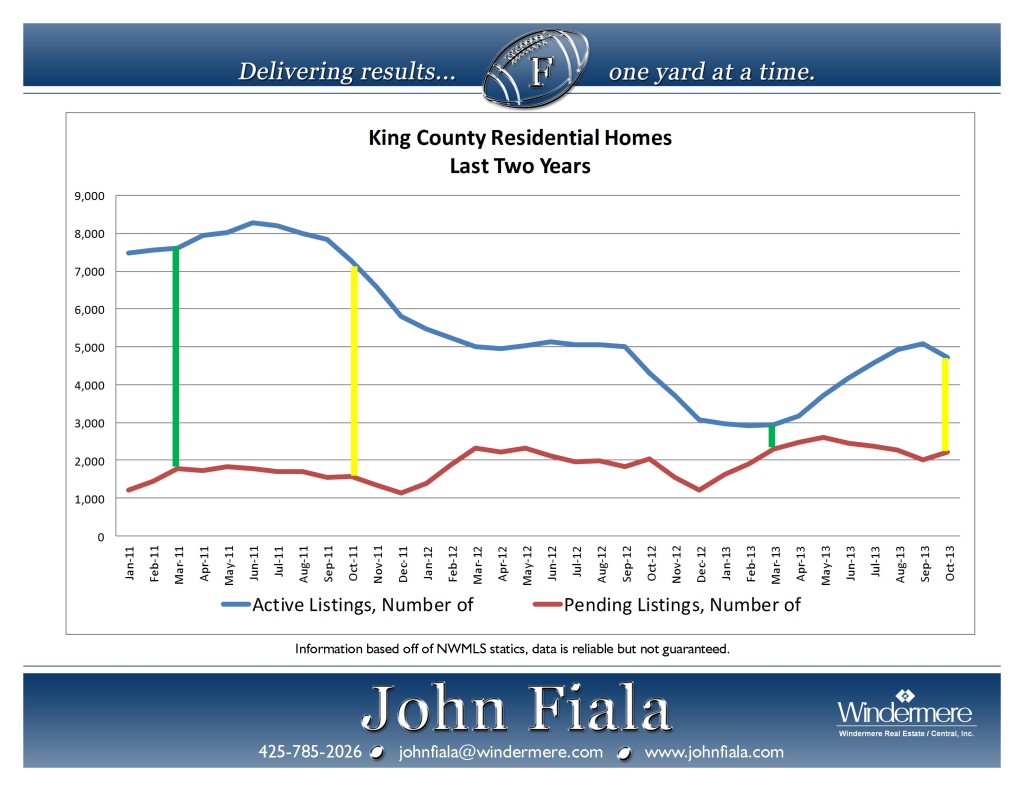
Have you heard that there is less inventory in the housing market right now? A good way to look at your competition as a Seller and as a Buyer is to watch the Active Listings and Pending Home Sales (homes under contract). Look at the space between the green line and the yellow line below on the chart for King County Residential homes. Notice the difference in lengths of the green lines and yellow lines over a two year period. This year, there is much more competition for Buyers trying to purchase a home because the ratio between Active Listings and Pending Home Sales is much higher from two years ago. Sellers have the advantage based on the lack of inventory and the high demand of people looking to purchase a home. Do you wonder what your specific area looks like? Just let me know how I can help.

Pending Home Sales Are High and Inventory Is Low In Seattle And Kirkland
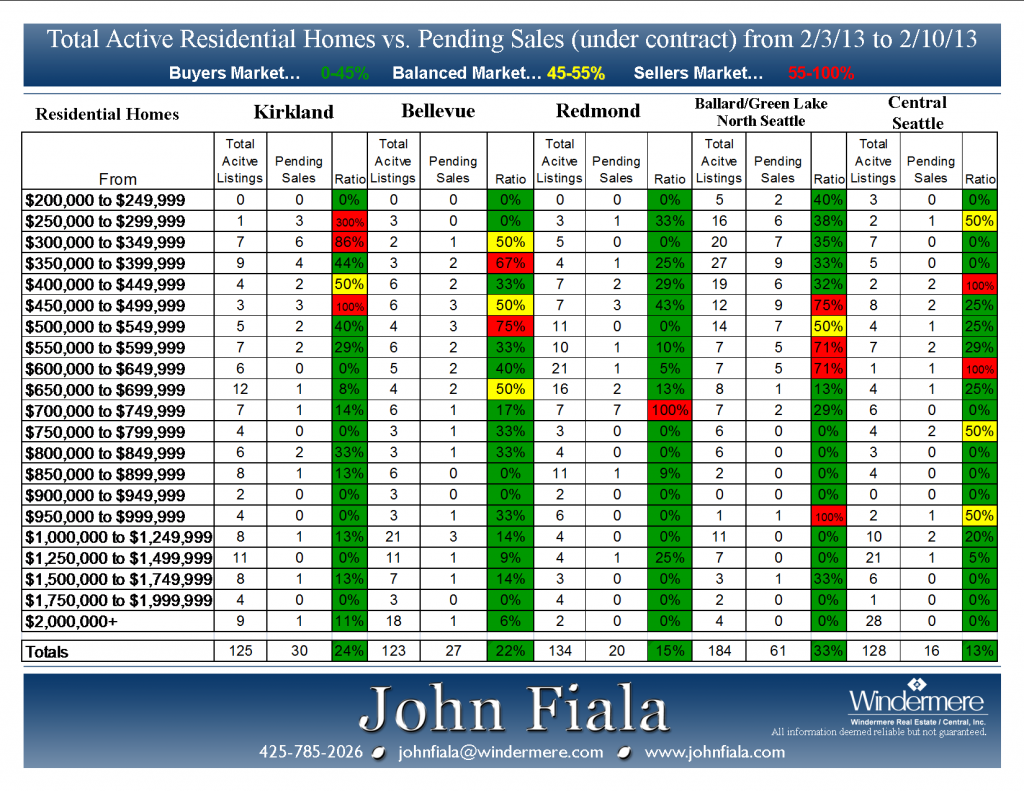
This information looks at the Active Listings versus Pending Sales for residential home for the week leading up to February 10th, 2013. This data shows the city and price range of the homes that have gone under contract in the last seven days compared to the active listings. North Seattle had the largest percent of homes go under contract with 33% for the week. Last year in North Seattle, that percentage was 12%. There were 343 homes listed last year compared to last week with 184 homes. Kirkland had 24% of the homes go under contract last week and last year at this time it was only 11%. In Kirkland, the active listings are currently at 125 and last year there were 209. It is amazing what a year can do. Inventory is down and the Buyers are out. The chart below has more detailed information about each area and price range.
Bellevue Washington Has A Strong Week in Pending Sales, Presented by John Fiala
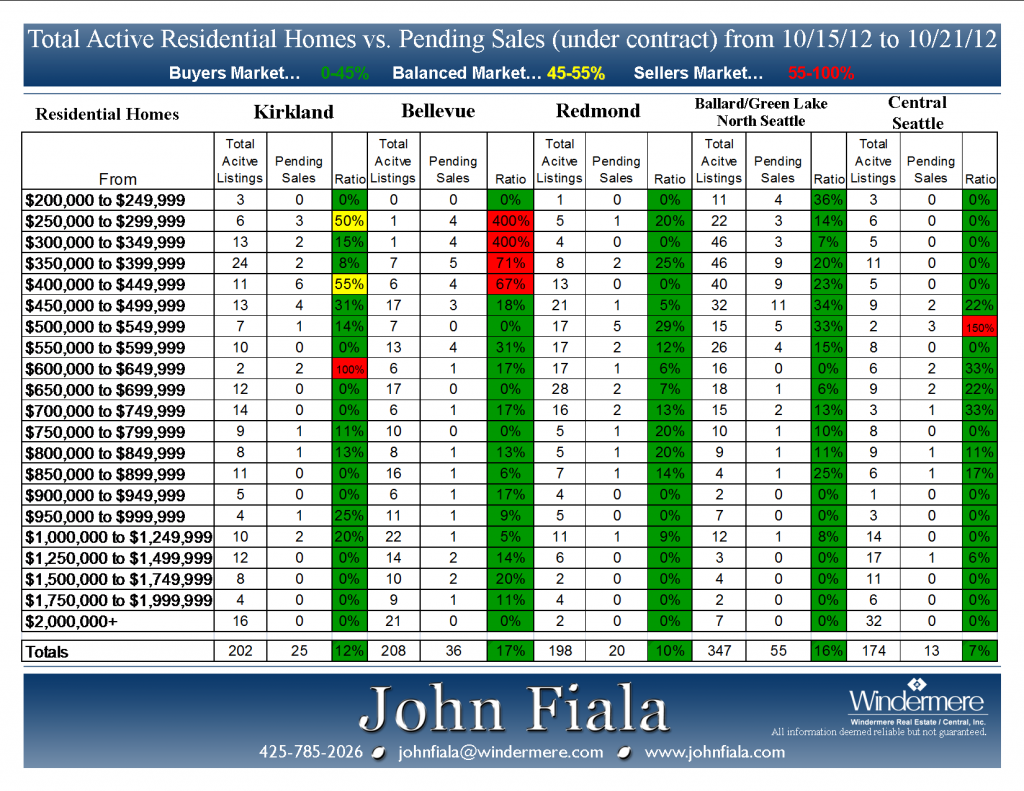
This chart looks at the active listings and pending sales for the date from 10/15/12 to 10/21/12. The pending sales (under contract) are for the previous seven days. This shows where the market is hot and who can have an advantage in the market by location and price point, essentially where the fish are biting in real estate.
If you have “Bellevue” in your address, your area had the highest percentage of homes go under contract for the week at 17%. Normally that title goes to North Seattle. Notice in Bellevue the price range from $250,000 to $349,999. There were five homes in each price range at the start of the week and by the end of the week, four of them were under contract with only one still Active. If you are a seller in that price range, the fish are biting. Buyers, you have competition in that price range in Bellevue.

Active vs Pending 10-21-12 Presented by John Fiala
Why rent when you can own, Condo for Sale in Lake Forest Park WA
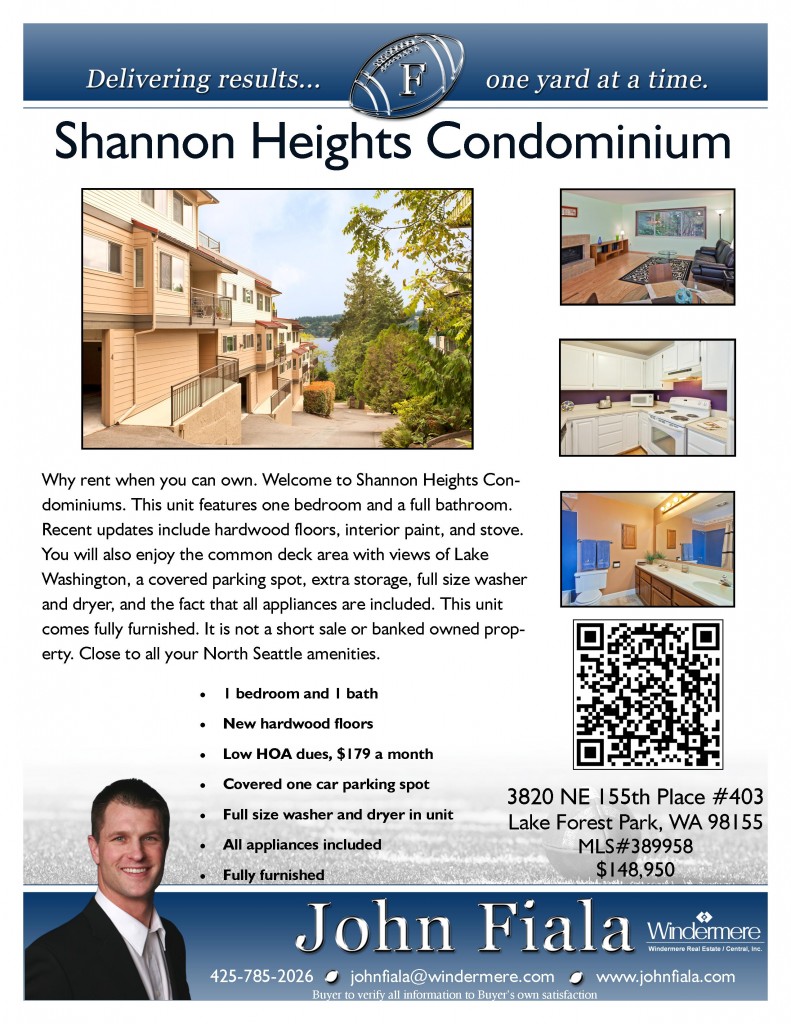
Why rent when you can own. Welcome to Shannon Heights Condominiums. This unit features one bedroom and a full bathroom. Recent updates include hardwood floors, interior paint, and stove. You will also enjoy the common deck area with views of Lake Washington, a covered parking spot, extra storage, full size washer and dryer, and the fact that all appliances are included. This unit comes fully furnished. It is not a short sale or banked owned property. Close to all your North Seattle amenities.

3820 NE 155th #403 Place Lake Forest Park Presented by John Fiala
Pending homes sales for Seattle and the Eastside areas for the week of 7-22-12
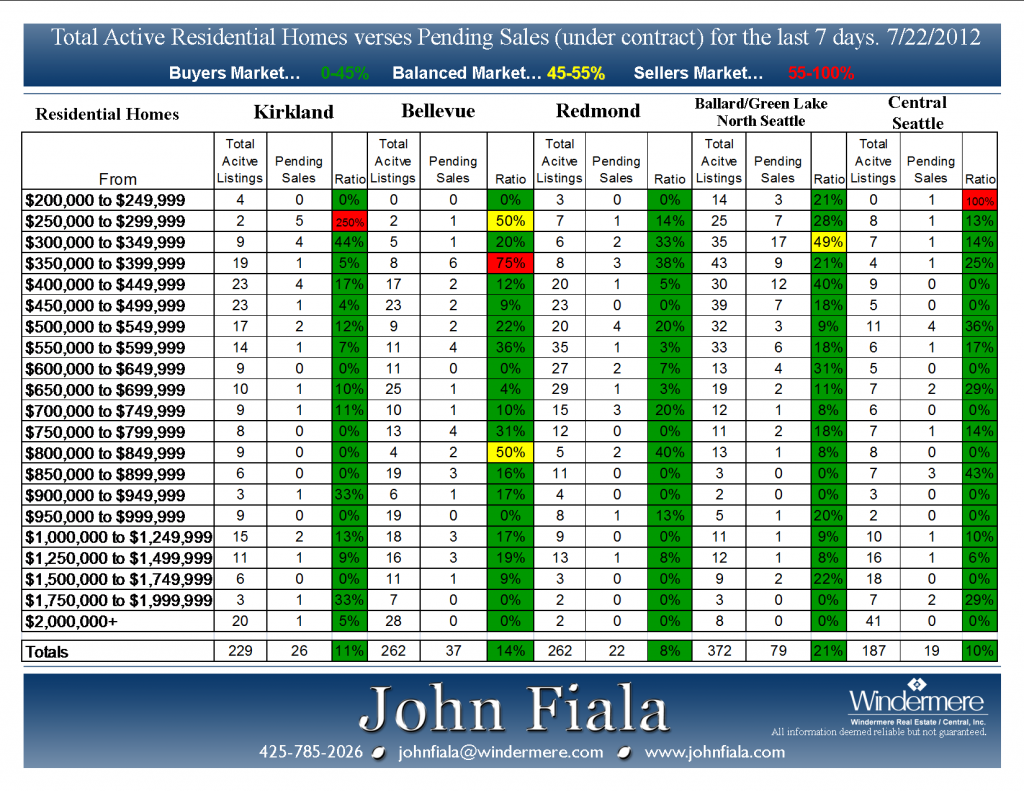
Here is a look at the weekly ratios ending on July 22, 2012 for residential homes in five areas. This information looks at what has gone Pending (under contact) over the last seven days. Of the five areas that I track, North Seattle had the highest percentage of homes go under contract with 21%. In Redmond, only 8% of homes went under contract. The hot price ranges for Sellers are in the red and yellow boxes below. You can see that in Kirkland, there are currently two homes active in the price range of $250,000 to $299,999 with 5 homes going under contract last week. You can look at your competition by price range and by your area to help you make an educated decision about listing your home or coming up with a strategy to buy a place. How does your area look?

Active vs Pending 7-22-12 presented by John Fiala
North Seattle leads with Pending home sales
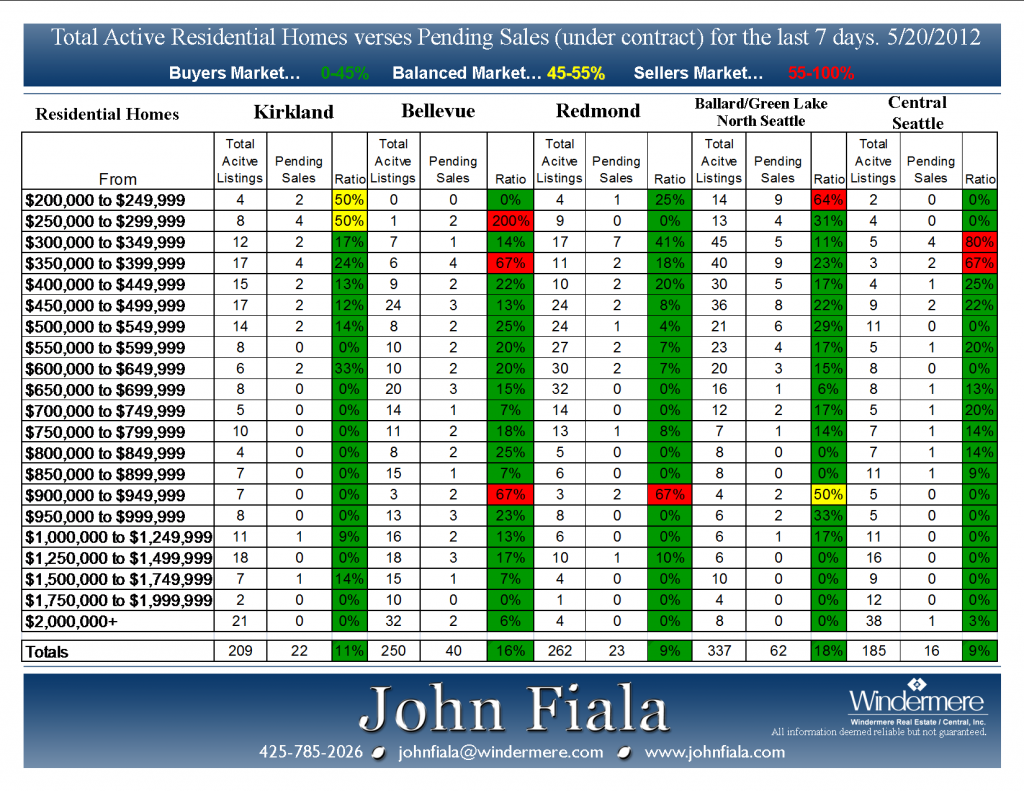
North Seattle had the highest amount of homes go under contract last week with 18% going pending of the five areas that I track for my blog. Bellevue had at least one home go under contract in each price range, even in the higher price ranges. The Red areas are considered Sellers markets. What does you area look like?

Active Listing vs. Pending Sales for 3-11-12 Video
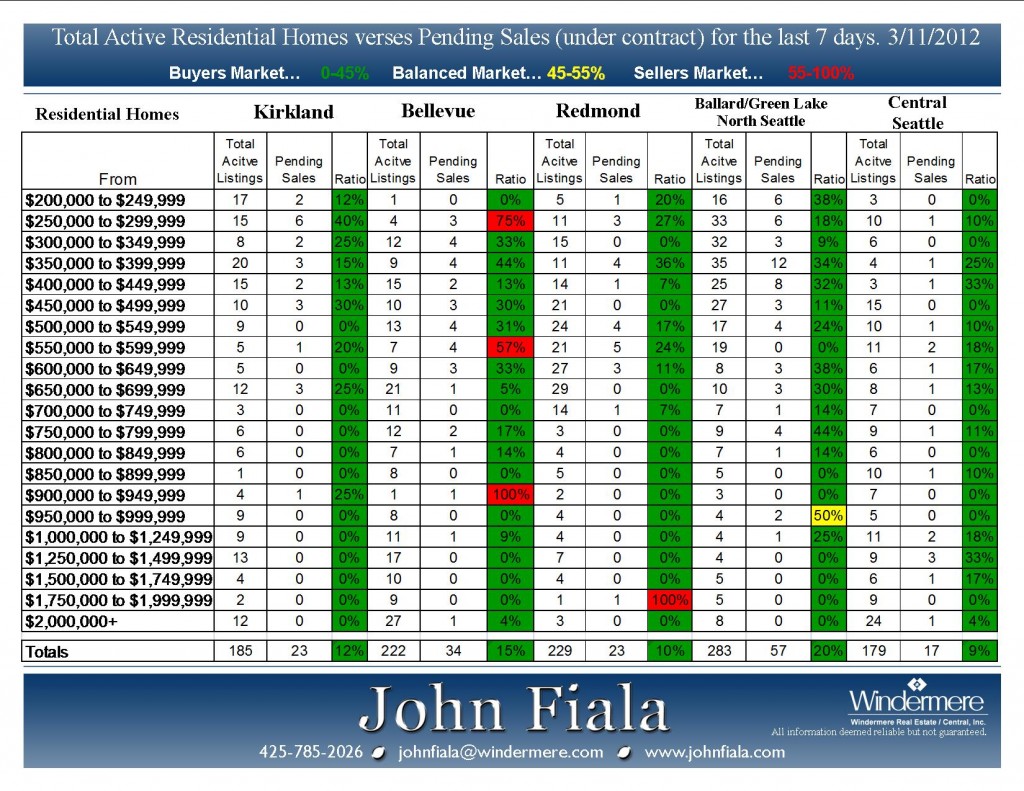
This video looks at the active listings and pending sales for the date of 3-11-12. The pending sales (under contract) are for the previous seven days. This shows where the market is hot and who can have an advantage in the market by location and price point, essentially where the fish are biting in real estate.
Bellevue had three Sellers markets this week which you can see in the red areas and Central Seattle had an active week for homes going under contract in the higher price ranges. Overall, the five areas that I track on this report, North Seattle had the highest ratios of homes going under contract last week.

John Fiala Ratios for Active Listings vs. Pending Sales 3-11-12
Hot Price Ranges in Kirkland and Bellevue Last Week, 3-5-12
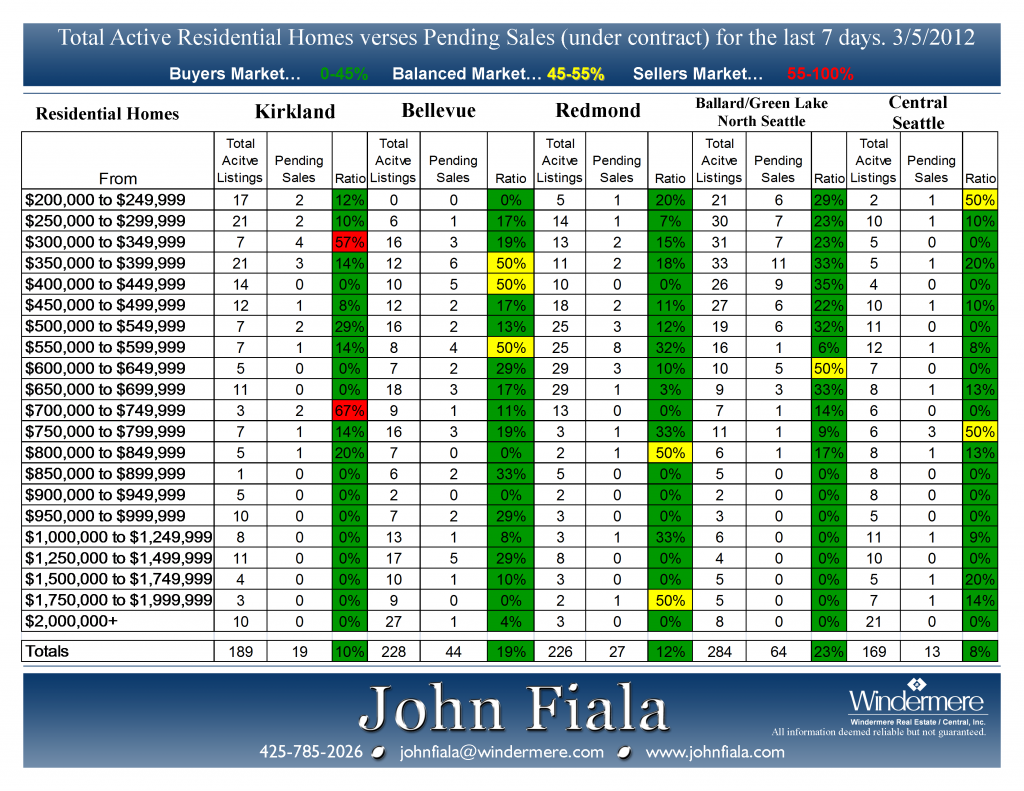
This data looks at the week of 3-5-12, North Seattle had the highest percentage of homes go under contract of the five areas that I track. Kirkland had a few hot price ranges for Sellers in the $300,000 to $349,999 range and also in the $700,000 to $749,999 range. Bellevue had a big overall jump in the amount of homes that went under contact this week compared to last week. Check out the chart to see the areas and price ranges that are active for Sellers in Red and Yellow.

John Fiala weekly ratios for 3-5-12
